While complex, the basic process of a signaling pathway can be described easily: after a cell encounters a signal, a messenger protein within the cell is activated and binds to DNA, altering gene expression in proportion to the signal. Despite the simplicity of the process (signal–>messenger–>DNA gene expression), these pathways contain numerous other components, whose functioning is necessary for regulating the activation of the messenger in response to signal. Dysregulation of pathway components is often associated with developmental defects and/or disease states.
In this study, we asked a simple question: how effectively does a single cell regulate its messenger protein in response to signal? We looked specifically at a messenger protein in the Tgf-β/Smad pathway known as Smad3. When a cell encounters Tgf-β protein (the signal), Smad3 (the signal-messenger) within that cell shuttles into the nucleus and alters expression of genes. Strikingly, when stimulated with Tgf-β signal, cells did not adjust the level of Smad3 to be equal in all cells. In fact, they don’t even come close, with some responses being up to 40 times stronger than neighboring cells (even though these cells were exposed to the same strength of signal).
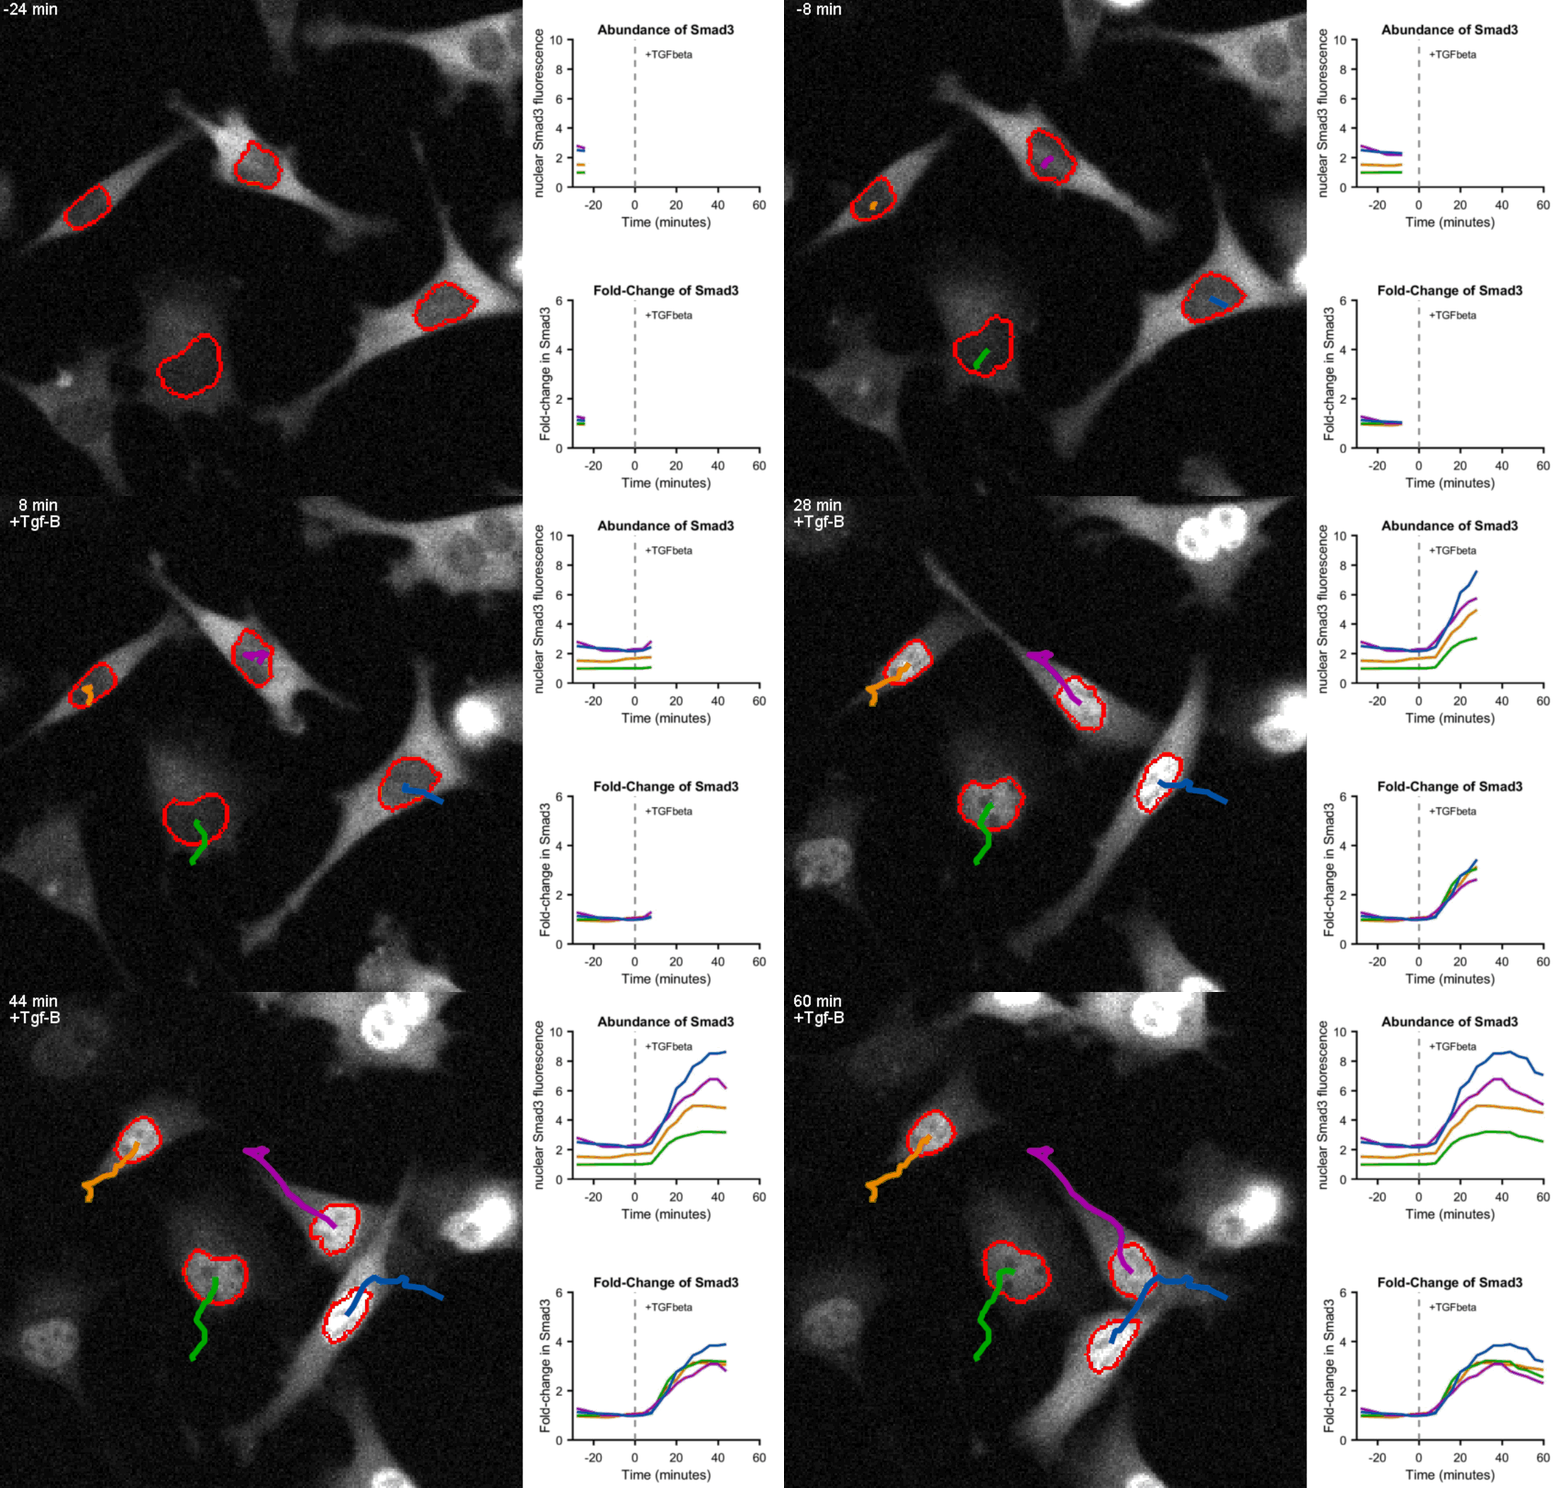
But all this means is that cells do not effectively regulate their messenger protein in the way we thought they might. We next wondered whether cells might regulate their messenger protein (Smad3) in a different way, a way we did not expect? We addressed this question by making time-lapse movies of the signaling process, using fluorescently-labeled Smad3. The movie data showed that while cells increase Smad3 to varying final levels after signal, the ratio of Smad3 level after signal divided by the level before signal is precise across cells. This can be seen in the video below, where the four cells increase Smad3 by ~3 fold. The before/after ratio of Smad3, or fold-change, is roughly 4 times more precise than the final level of Smad3, and increases the cells’ ability to accurately measure the strength of signal in their environment by about 5-fold.

Movie of mouse myoblast cells expressing fluorescent Smad3 responding to Tgf-β stimulation show precise fold-change. Upon exposure to Tgf-β, Smad3 is shuttled to the nucleus (circled in red) in each cell. Real-time quantification of Smad3 abundance and Smad3 fold-change in the nucleus of the four tracked cells is shown on the right hand side. Frames were taken every 4 minutes.
This result led us to ask a significant, specific question: do cells actually compute this ratio, dividing the level after signal by level before, and use that to control gene expression? We tested this directly in individual cells by measuring fold-change (using movies) and then measuring gene expression in cells (using a technique with a really long name: single molecule RNA fluorescent in situ hybridization). Testing for correlation, we found gene expression showed no correlation with the abundance of Smad3, and showed clear dependence on the fold-change of Smad3.
Understanding how signaling pathways function is a central goal in understanding the biology of humans and animals. We have shown in this work that Tgf-β signal is transmitted in Smad3 fold-change. Perhaps one of the most important implications of this work is that in order to understand signaling in a tissue (say a tumor, for example) it is insufficient to simply measure the total level of Smad3, one instead needs to measure the Smad3 response over time. Further, this study also adds to the growing list of pathways where fold-change detection has been proposed, suggesting that fold-change detection may be a widely implemented strategy in animal signaling pathways.
— Christopher Frick, 2017
Reference: Sensing relative signal in the Tgf-β/Smad pathway, PNAS 114 (14): E2975–E2982, 2017
